Databricks
Overview
Databricks provides starter workspaces to test out its diverse querying features. The discussion below uses those tables so that you can easily try them on your own.
Defining a Data Source
Overview
A Data Source is a Qarbine component responsible for retrieving data from somewhere. At a high level it has a name, a description and some arbitrary query string which when sent to the associated Qarbine Data Service endpoint returns some data. For Databricks , the query syntax is SQL and the associated Data Service is one configured to access Databricks . The overall execution flow for an analysis, including the optional prompt component, is shown below.

A single data source can be referenced by name from multiple Qarbine template components. This enables a single point of change when perhaps, an index is added, or some other query tweak is necessary. The alternative is to attempt to find all templates impacted by a schema or index change for example. The component reusability is especially beneficial when team members have varying roles and skills.
Using the Data Source Designer
Sign on to Qarbine and navigate to the Data Source Designer.
The initial drop down values are shown below.
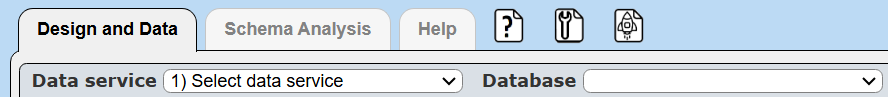
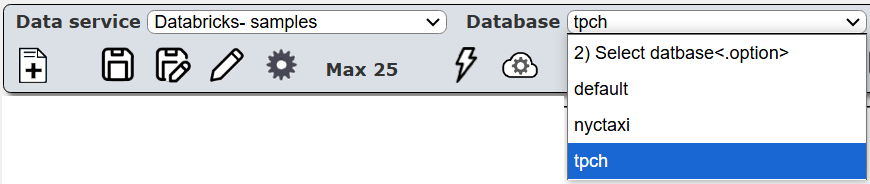
Choose your Data Service from the first drop down.

Choose your database from the second drop down.
For information use you can see the recognized tables and views in the left hand area as shown below.
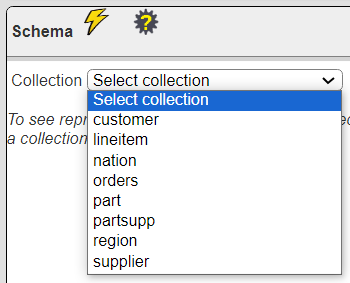
Choosing one displays the table structure defined.

This table information is very useful when authoring queries,
Running a Query
In this example a specific customer’s orders along with many of their details are retrieved.
SELECT
    c_custkey,    c_name AS customer_name,   o_orderkey,
    o_orderdate,  o_totalprice,
    l_linenumber,  l_quantity,  l_extendedprice,  l_discount,  l_tax, l_shipdate, l_shipmode,
    p_name
FROM  tpch.customer c
JOIN   tpch.orders o ON c_custkey = o_custkey
JOIN   tpch.lineitem l ON o_orderkey = l_orderkey
JOIN   tpch.part p ON l_partkey = p_partkey
WHERE   c_custkey = 2
ORDER BY o_orderkey, l_linenumber
LIMIT 15
Enter the query in the text area and click the  button.
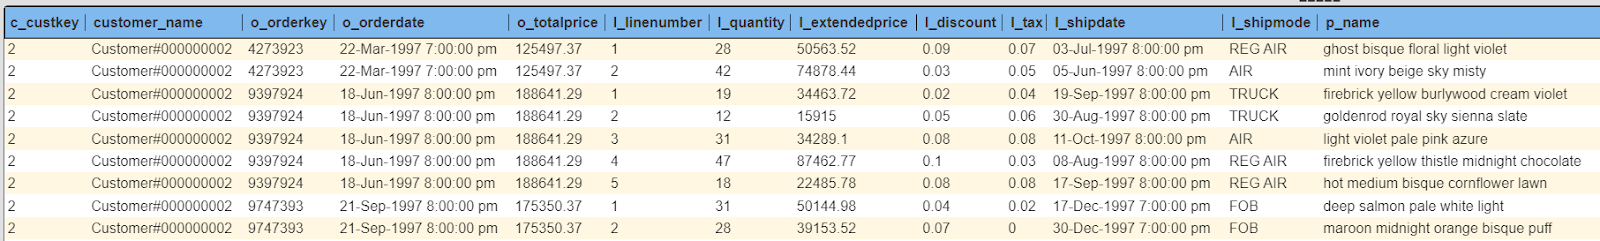
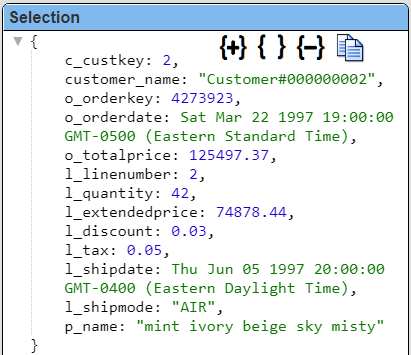
Selecting one of the rows

shows its details in the right hand area as shown below.
Managing Answer Set Size
The default maximum number of rows starts off at 25 for a new data source. This is useful to evolve a query from a concept to one that you have verified returns the desired answer set. As noted, any native way of limiting an answer set size is the preferred approach. This setting is in the component dialog as shown below and also accessible by clicking the ‘Gear’ icon.
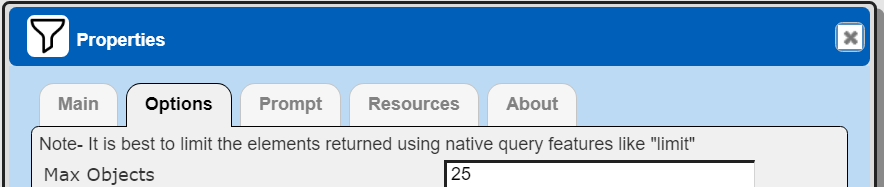
Once you are done drafting you can adjust this parameter. A “0” indicates there is no maximum. A number greater than 0 indicates to limit the final answer set size to that number of rows. This answer set truncation comes after any native query limit. So, if the answer set from the data endpoint is quite large, that content has to be returned to the Qarbine host. It then may truncate the number of rows. It is best to truncate at the query level (i.e., use a limit) to reduce the content sent from the data endpoint to the Qarbine host in the first place.
Adjusting the Maximum Rows
Recall the default maximum rows at the component level is 25. When you are satisfied with your query you can change that setting by clicking

Adjust the setting to “0” indicating no Qarbine answer set truncation.

Click

Saving Your Work
Click  to save the data source in the catalog. It is also remembered as a recent data source.
Creating Initial Components
The query used and the results data can be used to generate a Data Source and a Template component which may be each stored in the catalog.
Click  to create both an initial Template and a Data Source in the catalog.
Below are sample template values filled in.
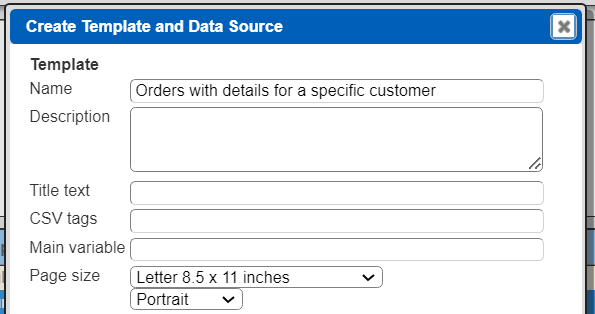
Below are sample Data Source values filled in.

Click
 .
.
Navigate to the catalog folder in which you want to save these components.
Click
.
In the next dialog presented, uncheck the first checkbox as highlighted below.

Click
.
Defining an Analysis Template
Overview
A template defines how to process the data being retrieved from Data Source queries and other data expressions. It also defines formulas, formatting options, and other analysis and presentation options. Team members can define templates which can be easily discovered by others for their running or to use as a starting point for other templates. The overall execution flow for an analysis, including the optional prompt component, is shown below

Using the Template Designer
In the steps described above we generated an initial template. This template has label and value cells for each of the columns in the answer set. Because of the number of columns in this example, the initial layout is a bit rough looking. The default generated template has the cells in a default order which should be changed.
Let’s rearrange some of the body cells of the template. Move cells around just like you would in PowerPoint. The generated template saves a lot of manual typing of labels and formulas though. We’ll rearrange the cells and remove a few to clean up the first draft of the template.
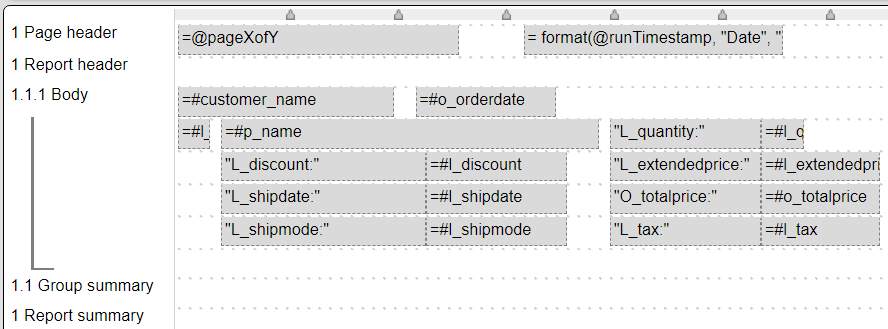
The updated template is shown below.
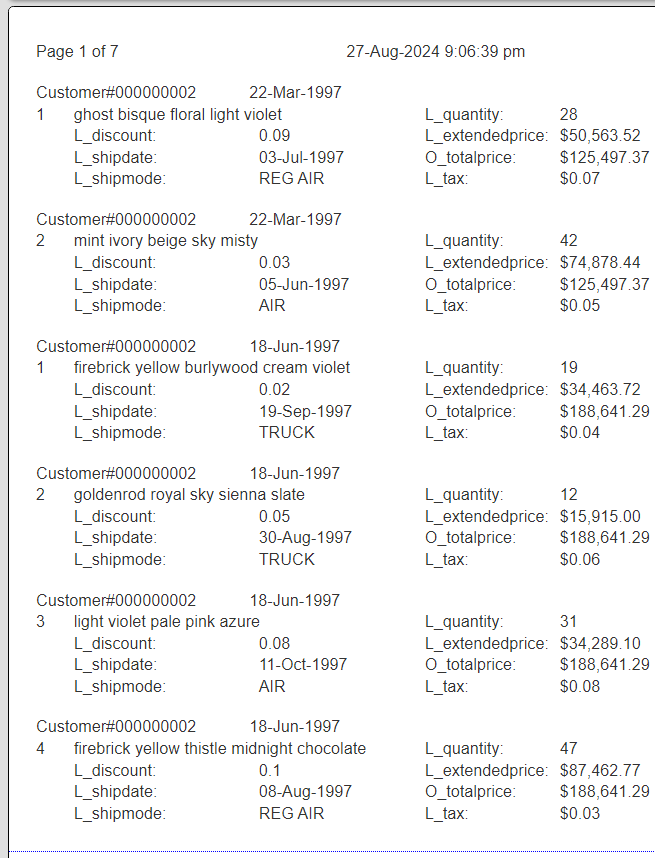
At this point the body content is emitted for each row. The result is shown below.
Go back to the design tab by clicking on it.

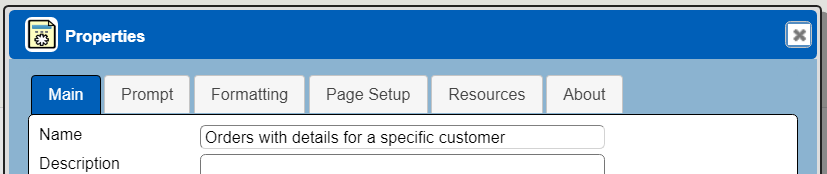
Clicking  shows the template’s properties.
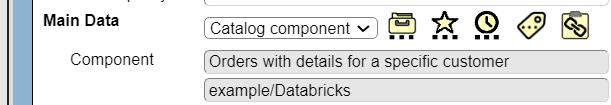
Notice the template is associated by name with the also Data Source.
Close the dialog by clicking
 .
.
The default labels are the column names which in the supplied Databricks data has 2 character prefixes associated with each table.
Click to save the template in the catalog.
Better Customer Order Formatting
Click  to save a copy of the template in the catalog with a new name.


Save the component by clicking
 .
.
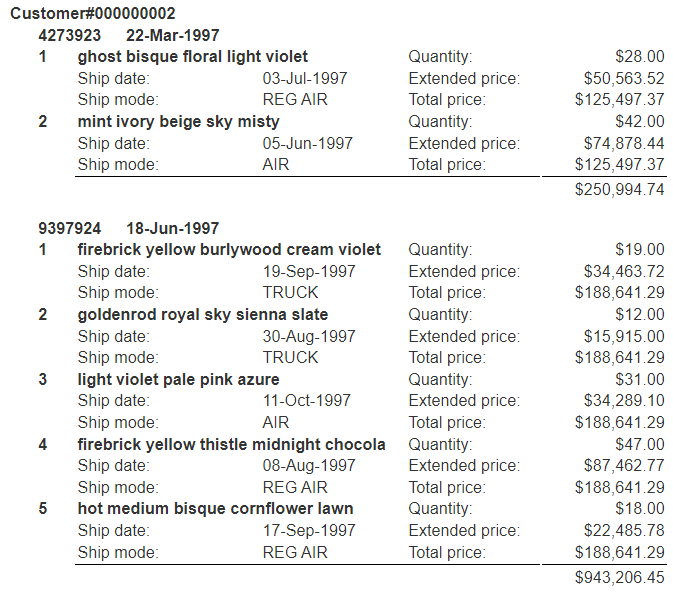
After the next editing steps the output will appear similar to the following.
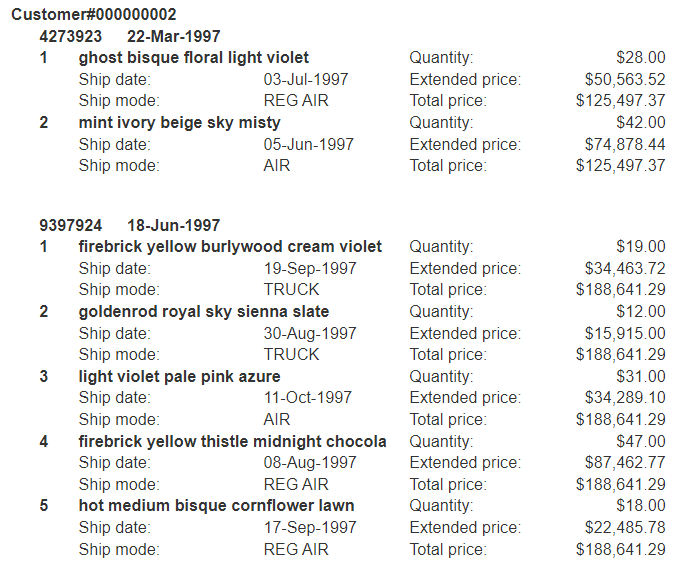
The template cell layout to achieve this output is shown below.
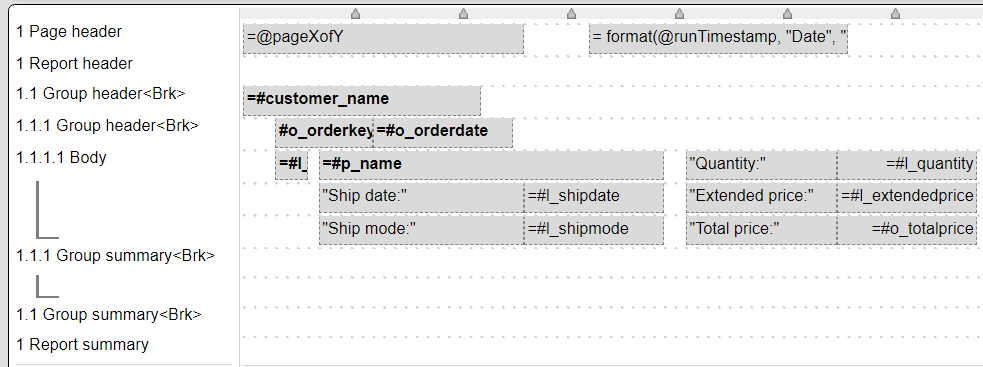
The 3 right most column cells all use currency formatting.
Group 1.1 has a break condition of

This break does not come into play given the hard coded customer key of the query. It will come into play soon when multiple customer orders are analyzed.
Group 1.1.1 has a break condition of

Click to save the template in the catalog.
Adding Aggregation Formulas
Click to save a copy of the template in the catalog with a new name.

Save the component by clicking
.
We can add additional cells such to sum the total per of each order. The summation is added to the group 1.1 summary line. That line looks like the following

The far right cell’s formula is
orderTotal =sum(#o_totalprice)
It and the first cell on the line both have the following border.

There is a convenient pop up menu option to create aggregates. Simply select the source cell and then right click for the context menu. Choose the type of aggregate and a new cell is created below the source cell on the containing group’s summary line.


Our updated formatted result is shown below.
Adding Grand Totals
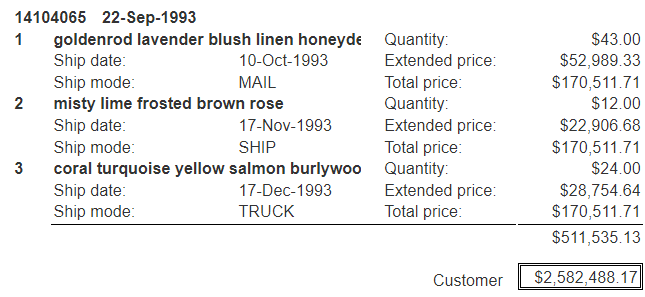
Finally, it would also be useful to have a total for all of the customer’s orders in this analysis.
On the Group 1.1 summary line we can add the following cells.

The aggregation formula is
=sum(@orderTotal)
Its borders are

Running this results in the following ending output.
Save Your Work
Click to save the template in the catalog. It is also remembered as a recent template.